ML Systems Lab
A reproducible benchmarking framework for ML inference across heterogeneous hardware: laptops, single-board computers and servers, from one config file and one command.
pip install ml-systems-lab
mlsys probe                     # what this machine can measure: power, thermals, GPU, clocks
mlsys membw                     # its sustained DRAM read ceiling, in about a minute
Both work straight after the install, with no config and no model. The quick start goes from there to a first sweep, and the example configs are ready-to-edit starting points for the questions people most often benchmark for.
Why it exists
Comparing inference performance across machines is mostly a bookkeeping problem.
llama-bench and onnxruntime_perf_test each measure one backend well and report a
table with no hardware, no thermal state and no power in it. Six weeks later nobody can
say whether a number was taken on a throttling board, which compiler produced the
binary, or how much of the DRAM ceiling that run reached.
ml-systems-lab makes that context part of the measurement. Every run produces one
self-describing JSON record carrying the hardware, OS, kernel, backend build commit,
model, quantization, the metrics, and the physical state of the machine while they
were taken: per-rail power, temperature, clocks, throttle flags, memory pressure. Runs
are addressed by a deterministic hash of their specification, so an interrupted
campaign resumes and a corrected point re-executes exactly. Failures are records too,
with their raw output kept, so a parser bug is fixed by reparsing rather than by
repeating an overnight campaign.
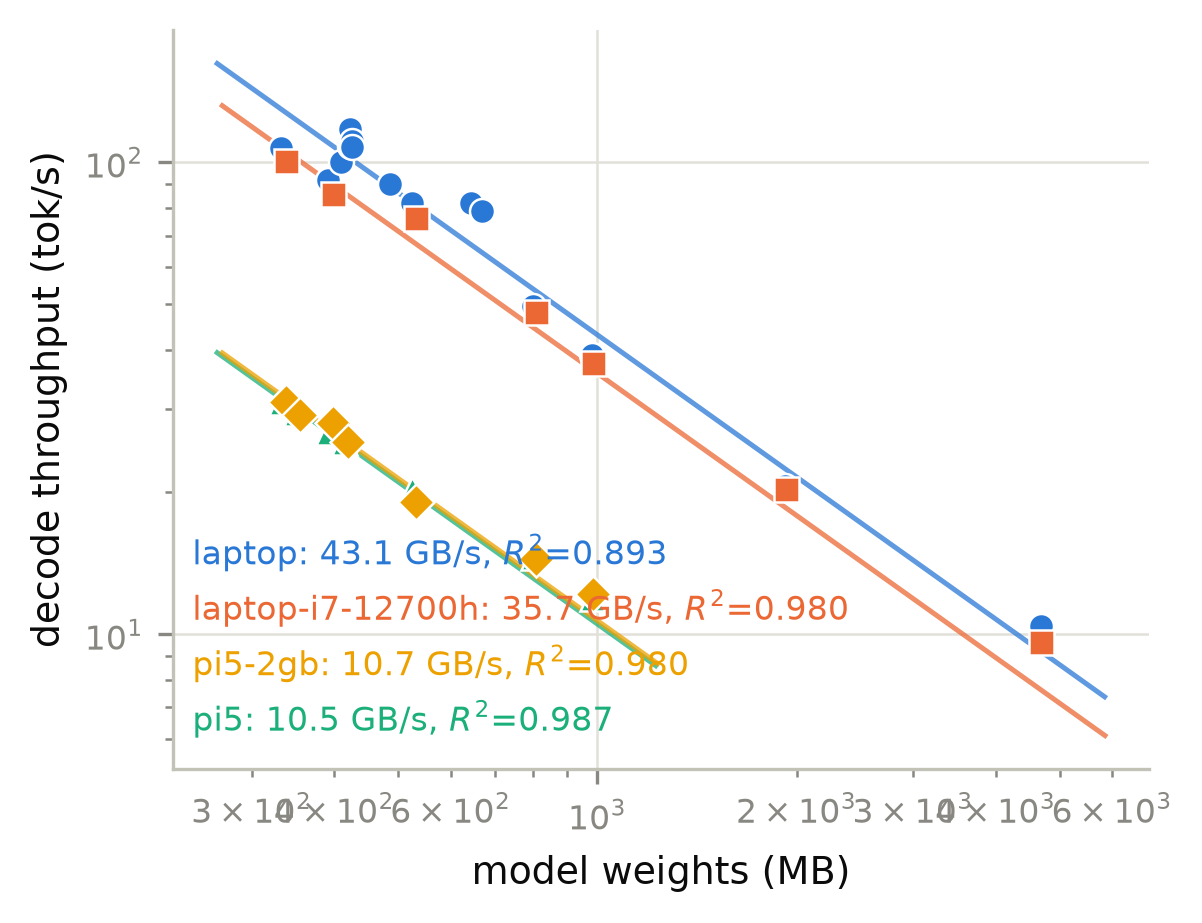
Every point is a different model or quantization; every line is one device's effective memory bandwidth. Two independent Pi 5 campaigns and two laptop campaigns land on top of each other. The records behind this figure ship in the repository; see shipped datasets.
What it measures
| Metric | How |
|---|---|
| TTFT (time to first token) | streaming request against llama-server, first-chunk timing |
| Prefill / decode throughput | llama-bench, parsed from its JSON output |
| End-to-end request latency | same streaming path, submit to last token |
| Single-inference latency (mean, p50/p95/p99) | ONNX Runtime, timed in-process on the device |
| Memory | peak RSS, plus free-memory and swap state around every run |
| CPU utilization | /proc/stat deltas (Linux), GetSystemTimes + NtQuerySystemInformation (Windows), per core when it pools to the aggregate |
| Temperature and throttling | sysfs thermal zones, Pi throttle bitmask, in the record not a side file |
| Power and energy | Raspberry Pi PMIC per-rail (core vs DRAM split), Intel RAPL where present, NVIDIA GPUs through whichever instrument the part supports, named in the record |
| Derived | decode bandwidth, roofline utilization %, energy per token |
Anything a platform cannot measure is reported as absent, never as zero.
How it reaches a machine
config.yaml --> RunSpecs --> Device --> agent (on the device) --> RunRecord --> analysis
                              |
                              +-- LocalDevice   (this machine, agent as subprocess)
                              +-- SSHDevice     (agent pushed over SSH, runs remotely)
                              +-- K8sDevice     (agent streamed into a pod, runs there)
The agent runs on the device under test, so the benchmark and the telemetry sampler are colocated and nothing crosses the network inside a measurement window. It is pure standard library and is copied, not installed: a board needs Python 3.9 or newer and its inference backend, nothing else.
Where to go next
- Quick start: one machine, then a board over SSH, then several at once.
- Example configs: templates to copy, and the studies behind the shipped data.
- Measurement method: the rules the framework enforces, and why each exists.
- Several machines at once: the concurrent scheduler and its failure handling.
- Agent image and k3s: building the container and running sweeps in pods.
- Python API: reading records and analysing them from your own code.
Related tools
Other tools by the same author for people measuring local LLM inference:
- llama-roofline: is your llama.cpp decode memory-bandwidth-bound? One command measures the ceiling and compares.
- qgemv-roofline: quantized GEMV kernels for batch-1 LLM decode, written from scratch and measured against a bandwidth roof the repository measures for itself.
- gguf-faultscope: what one flipped bit does to a quantized GGUF model, and where it has to land to matter.
Citing
Archived on Zenodo; the concept DOI
10.5281/zenodo.21867055 always resolves to
the latest version. CITATION.cff in the repository carries the full citation metadata,
and GitHub's "Cite this repository" button renders it.