//Lab
Where the numbers come from.
Every claim on this site traces back to hardware sitting on a desk. This page is the machines, the on-board instrumentation they already carry, and the rules a result has to survive before it gets written down.
- Machines
- 4
- On the bench
- 3
- Rules
- 7
- Telemetry
- 13 h open dataset
One diagram explains most of it.
The roofline. Performance climbs with arithmetic intensity until the machine runs out of memory bandwidth or compute, whichever comes first. The research program is, in one sentence: real edge workloads live on the left slope.
- 9
- CNNs + 1 ViT characterised
- 13 h
- Open telemetry dataset
- 0.98
- Decode roofline R², Arm and x86
- 2 of 9
- INT8 results that reverse sign across ISAs
The bench.
Small, deliberate, and instrumented without adding a single sensor: the power telemetry and performance counters are already on the die. A short list of machines that are actually measured beats a rack of machines that are merely owned.
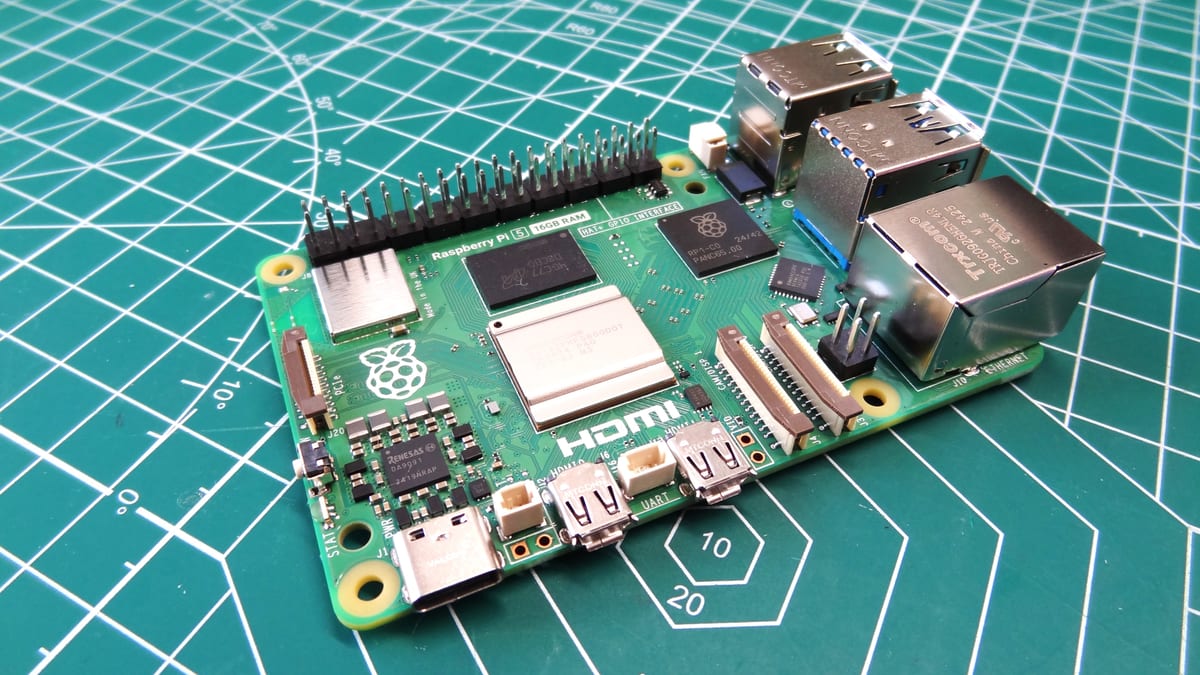
Raspberry Pi 5
Primary edge-inference bench
- › Broadcom BCM2712, 4x Arm Cortex-A76
- › LPDDR4X, shared-bandwidth memory subsystem
- › On-board PMIC power telemetry
- › Hardware performance counters via perf
Every published edge-inference number on this site came off this class of machine.
Cisco UCS C220 / C240
Server-class measurement
- › Rack servers, NUMA topology
- › CPU inference and memory-hierarchy work
- › Power measurement at the chassis
Framed to the hardware vintage: NUMA, memory wall, CPU-inference energy. Deliberately not a modern-LLM story.
i7-12700H laptop
Cross-architecture check, and the hybrid-core work
- › 6 performance cores, 8 efficiency cores, DDR5
- › RTX 3050 Laptop, treated as a separate device by the harness
- › Single-node k3s cluster in WSL2, containerd runtime
- › Intel RAPL energy counters
- › Roughly four times the memory bandwidth of the Pi
This machine is why the results are not a Raspberry Pi story. The memory-bandwidth law was re-measured here on a completely different architecture and held with the same goodness of fit, and the mixed performance and efficiency cores are the subject of their own paper. The GPU in it used to be listed separately, which flattered the bench: it is one laptop. The k3s cluster is on this row for the same reason. It is a Kubernetes control plane and its pods running on these cores, not a second machine, and the harness has to be told they share a CPU so it does not run them against each other and call the contention a result.
iMac G3, 1998
Because it is there
- › Bondi blue
- › Boots
Not part of any experiment. It sits on the bench and it works, which is the point.
Rules a result has to survive.
Written down because they cost something. Each of these has, at least once, meant deleting a result that would have made a better headline.
- 01
Measure the machine, not the toolchain
A benchmark that does not control for its own toolchain is measuring the wrong thing. Before a quantized model is labelled, its operator graph is checked, so the label says how it was actually built rather than how it was meant to be built.
- 02
Record the state of the machine, not just the number
Every run writes down the clock speed, the temperature, the throttle bits and the power draw alongside the result. That caught five measurements taken while something else was running on the board, with a run-to-run spread of 30 to 103 percent against a campaign norm under 2.5 percent. Without the record they would have gone quietly into an average.
- 03
Publish the negative result
Operating regimes where a method does not help are reported next to the ones where it does, and a paper says what the data supports rather than what the first run suggested.
- 04
Ship the harness
Every published result has a public repository with the code and data that produced it, archived on Zenodo with a citable DOI. If a reviewer cannot re-run it, it is an anecdote.
- 05
Record what constrained the run, not only what ran it
A throughput number taken under a CPU quota is not comparable to one taken without, so every run in a container writes down the cgroup ceilings that applied to it, read from inside the container rather than copied out of the config that asked for them. The two disagree more often than you would like: a limit can be rewritten by an admission controller, rounded by the runtime, or turned into a reservation because Kubernetes copies limits into requests when requests are absent. Believe the container, not the file.
- 06
Instrument power, do not model it
Energy claims come from on-board power telemetry sampled during the run, not from a thermal design power figure multiplied by a duration.
- 07
State the regime
Most control policies help in some operating regimes and hurt in others. Reporting the boundary is more useful than reporting the win.
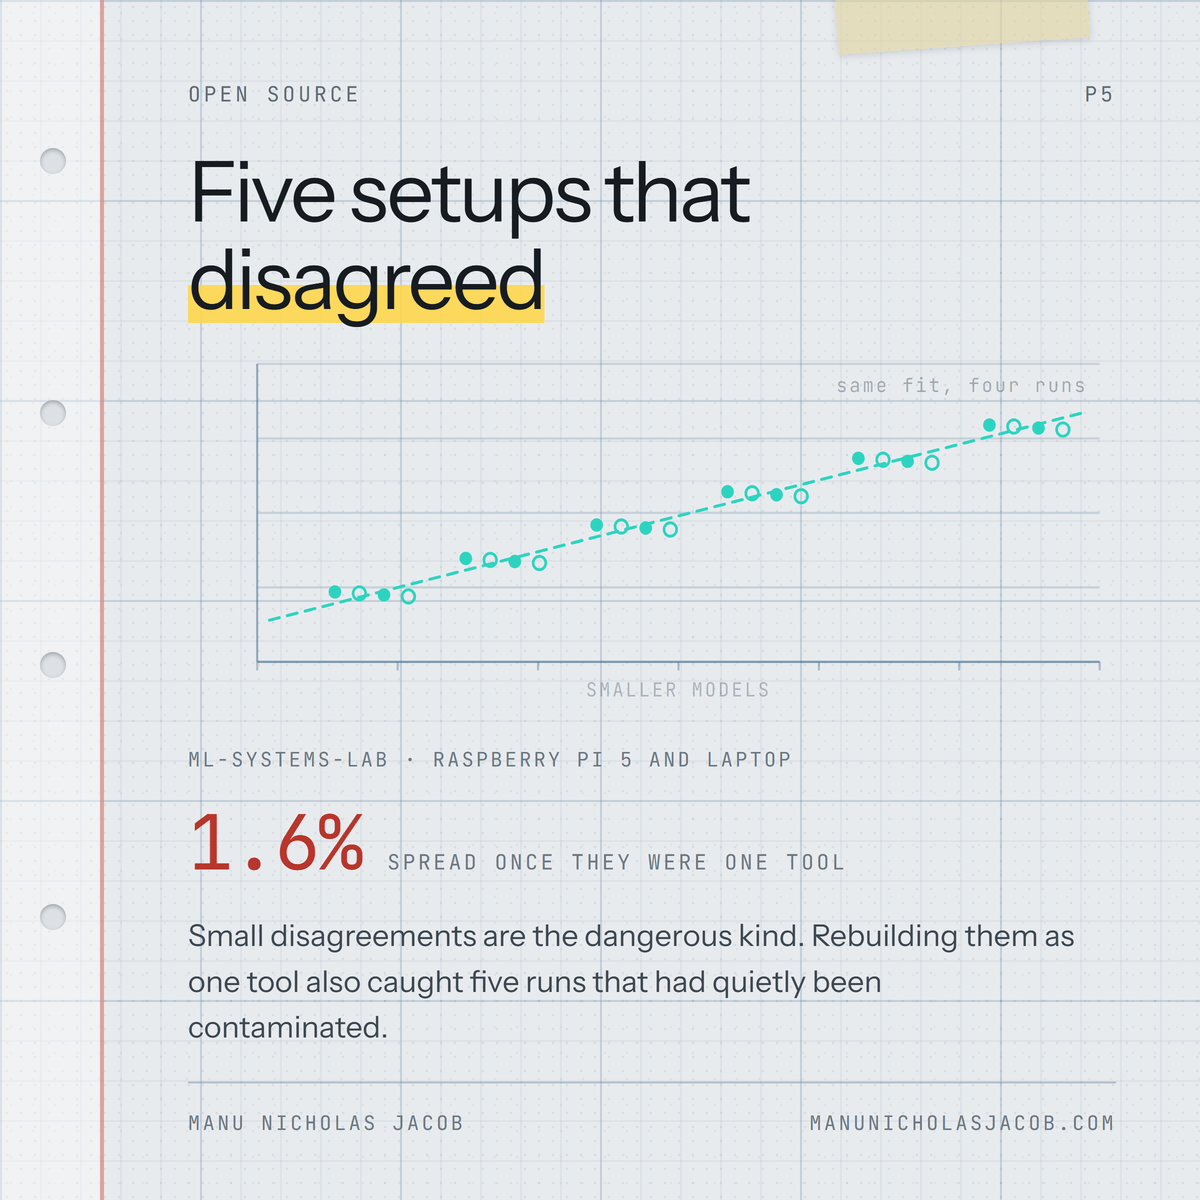
Why the rules exist
Five harnesses, five answers, one tool.
Every paper grew its own measurement scripts until the differences between them were indistinguishable from findings. Rebuilding them as one framework collapsed the spread to 1.6 percent, and caught five quietly contaminated runs on the way. The rules above are what that cost.
Read the full account →